Those topics might be interesting, but they are not the topic that interest me today.
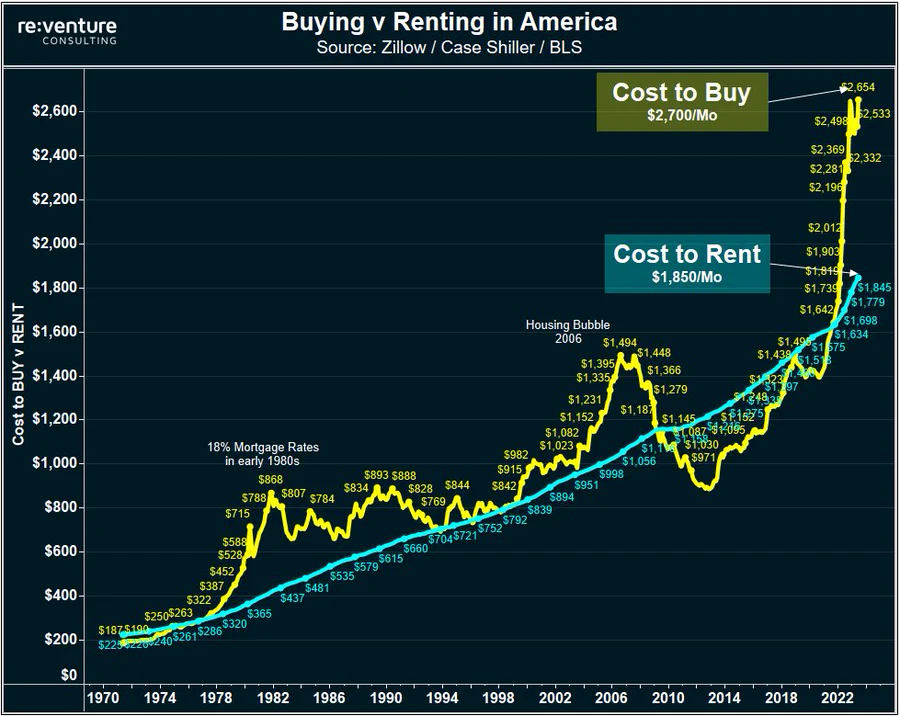
What interest me today is solely related to the "cost to buy", the mortgage payment, and whether or not how you frame that monthly payment might influence a person's conclusion around the value of that payment.
A unique feature of the U.S. mortgage market is that loans are generally freely prepayable by the mortgagor/borrower. In financial terms, the borrower is long an option to prepay. Without getting into all the details, most homeowners will refinance their current mortgages if interest rates fall and they are able to reduce their monthly payments. The holder of the mortgage loan asset obviously is aware of the fact that their cash flow stream could be curtailed which poses two problems for them: one, they don't know how long they will receive payments and two, if they get prepaid they will now likely have to reinvest in a lower yield environment. The mortgage originator/lender needs to be compensated for this risk.
In an interest rate environment with higher yields and higher volatility, the value of the prepayment option being sold by the lender to the borrower will rise. The mortgage borrower will need to pay more in their monthly payment to compensate the lender, but will equally be acquiring a more valuable option, a point that seemingly is never discussed.
The point being, when you decompose mortgage rates, there is a benchmark, or risk free component, typically considered to be the 10-year treasury yield and there is the cost of the call option that allows the borrower to prepay the mortgage without penalty.
My question is, if you represented the above "cost to buy" as a mortgage payment split into two components, the first being the monthly mortgage payment excluding the value of the option (the sum of the benchmark rate and what is known as the Option-adjusted spread) and second being the amount of the monthly payment that is for the option, if that would change any conclusions reached when people read these graphs? I'm open to hearing thoughts.
I am also sure that someone with a Bloomberg Terminal can find and use the Z-Spread and OAS Spreads to calculate the value of the option embedded in the mortgage rate.
No comments:
Post a Comment